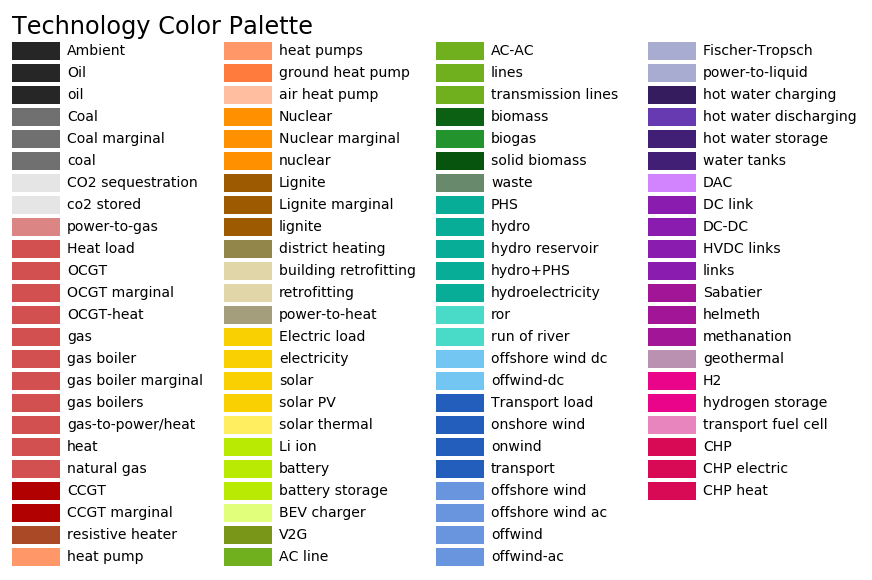
Plotting and Summary#
Warning
The corresponding code is currently under revision and has only minimal documentation.
Rule plot_p_nom_max#
![digraph snakemake_dag {
graph [bgcolor=white,
margin=0,
size="8,5"
];
node [fontname=sans,
fontsize=10,
penwidth=2,
shape=box,
style=rounded
];
edge [color=grey,
penwidth=2
];
0 [color="0.42 0.6 0.85",
fillcolor=gray,
label=plot_p_nom_max,
style=filled];
1 [color="0.58 0.6 0.85",
label=cluster_network];
1 -> 0;
}](_images/graphviz-c59199336655b0c51c55c85bf9212b72f86dc10b.png)
Rule make_summary#
![digraph snakemake_dag {
graph [bgcolor=white,
margin=0,
size="8,5"
];
node [fontname=sans,
fontsize=10,
penwidth=2,
shape=box,
style=rounded
];
edge [color=grey,
penwidth=2
];
0 [color="0.47 0.6 0.85",
fillcolor=gray,
label=make_summary,
style=filled];
1 [color="0.11 0.6 0.85",
label=solve_network];
1 -> 0;
}](_images/graphviz-6c3ba299a0680784b0ef9f758e9fd4e59a7df7a4.png)
Creates summaries of aggregated energy and costs as .csv files.
Relevant Settings#
costs:
    USD2013_to_EUR2013:
    discountrate:
    marginal_cost:
    capital_cost:
electricity:
    max_hours:
See also
Documentation of the configuration file config.yaml at
costs, electricity
Inputs#
Outputs#
Description#
The following rule can be used to summarize the results in separate .csv files:
snakemake results/summaries/elec_s_all_lall_Co2L-3H_all
                                     clusters
                                         line volume or cost cap
                                            - options
                                                    - all countries
The line volume/cost cap field can be set to one of the following:
lv1.25for a particular line volume extension by 25%lc1.25for a line cost extension by 25 %lallfor all evaluated capslvallfor all line volume capslcallfor all line cost caps
Replacing summaries with plots creates nice colored maps of the results.
Rule plot_summary#
Plots energy and cost summaries for solved networks.
Relevant Settings#
Inputs#
Outputs#
Description#
Rule plot_network#
![digraph snakemake_dag {
graph [bgcolor=white,
margin=0,
size="8,5"
];
node [fontname=sans,
fontsize=10,
penwidth=2,
shape=box,
style=rounded
];
edge [color=grey,
penwidth=2
];
0 [color="0.00 0.6 0.85",
fillcolor=gray,
label=plot_network,
style=filled];
1 [color="0.50 0.6 0.85",
label=solve_network];
1 -> 0;
}](_images/graphviz-cab8a8d2f84fd678c142fb754eaf273e9767c52e.png)
Plots map with pie charts and cost box bar charts.
Relevant Settings#
Inputs#
Outputs#
Description#

